Infographics are the second most popular content marketing approach. The 2017 State of the Creator Economy (SOCE) study revealed that 49 percent of US content marketers used infographics as some point. A content marketing infographic can get your point across in a way that actively engages an audience, which is part of their appeal among marketers and consumers alike. But which are the best content marketing infographics?
What makes an infographic really effective? The best content marketing infographics tell a story behind the images. Here are some great examples of visual storytelling.
IZEA – State of the Creator Economy
 Here at IZEA we annually release one of the best content marketing infographics in the industry. The 2017 State of the Creator Economy study infographic presents the comprehensive report’s findings in a snackable and easy to digest format that highlights the key takeaways for marketers.
This year’s study compares trends based on three years of industry data and was Conducted in partnership with research firms The Right Brain Consumer Consulting, Halverson Group, Lightspeed GMI, and Research Now.
Influencer Marketing and Content Marketing continue to reign supreme for US Marketers, driving the most value for brands and agencies compared to all other forms of marketing and advertising investment.
Quill – Vacations Are a Must
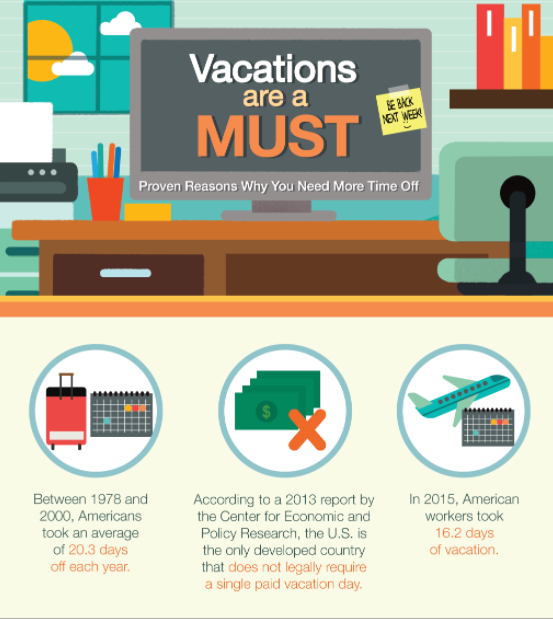 People in the US don’t take all of the vacation days they are given by their employers. In fact, American workers leave a combined 658 million vacation days on the table each year. Quill, a career advice website, put together an infographic highlighting the importance of taking a vacation.
Vacations Are a Must highlights the bleak state of vacation time in the US in one of the best content marketing infographics out there. Using colorful, eye-catching graphics, it points out the impact on workers of not taking the days they are due, and the sorry state of “vacation” for most people in the country.
The infographic is well laid out. It starts by illustrating the problem, then details the effects of the problem and how to solve it. To put everything together, it finishes with a call to action, encouraging US workers to put their vacation days to good use — by actually taking a vacation.
Outbrain – History of Content Marketing
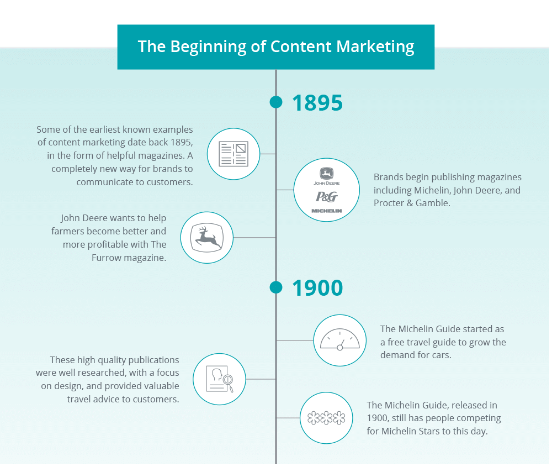 The content advertising company Outbrain, whose links you’ve probably seen at the bottom of countless articles across the internet, put together one of the best content marketing infographics highlighting the history of content marketing, going all the way back to 1895.
It’s an engaging timeline that helps you see how content marketing has evolved over the past 100 plus years. It’s also a good reminder that there’s nothing new under the sun. The internet didn’t invent content marketing — it just took a good thing and ran with it.
Point Visible – Content Marketing Stats (2017 Edition)
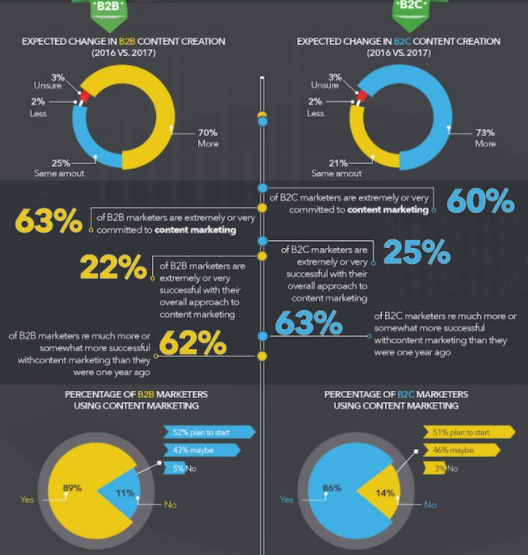 As a content marketer, you probably come across your fair share of statistics and numbers. If only there were a way to make them easier to digest and process.
There is. Point Visible has put together an infographic explaining the state of content marketing for 2017. It’s one of the best content marketing infographics out there and full of stats and details that would usually make your eyes glaze over. But, since the information is presented visually, your brain is likely not only to comprehend all the data, but also remember it and recollect it later on.
The infographic is particularly helpful because it gives you an idea of what your fellow marketers are doing with content marketing, how they think they are doing, and what they are using to get their messages out to the public.
Content Marketing Institute – Types of Content We Crave
 Some of the big questions content marketers often have are “what type of content is the most effective?” or “what type of content do people want?”
The 31 Types of Content We Crave infographic from the Content Marketing Institute is actually a two-parter. The CMI originally made part 1, with 21 types of content. Then it added a second part, with 10 more types of content.
This one of the best content marketing infographics is particularly helpful. That’s because it doesn’t just list content types that you know, such as blog posts or video. Instead, it focuses on the qualities of content that people look for. If you’ve ever struggled to figure out what your audience wants or needs to read or consume, this is the infographic for you.
Fix – How to Avoid a Hangover
 An infographic about hangover might seem like a strange. It’s especially strange for a website that sells parts. But, since Fix dubs itself as a place to go for expert advice, the topic makes sense.
Lots of misinformation is out there about the effects of alcohol and drinking. But everyone wants to know the best ways to avoid or cure a hangover. The Fix’s How to Avoid a Hangover’s best content marketing infographics seek to set the record straight. It uses images to illustrate alcohol’s effects on the body, and the different effects different types of drink have. It takes a lot of complicated, scientific, and medical information and condenses it into an easy-to-understand form.
Want to put your content marketing on autopilot?
Learn about what content subscription packages can do for your business today!
Writing takes time you don’t have. Let IZEA do all the work! Leverage the largest network of content creators in the world to produce high quality content at any scale.