December is the time of year to look back and reflect on everything that happened during the year, including the music you listened to. This month is when the music streaming app Spotify shows its users a year in review for their own music. Spotify Wrapped contains sharable features like your top five artists, your “audio aura” and even how many minutes you’ve listened to music on the app over the course of the year.
The feature has become much more than something to look at by yourself. You can open Instagram, Twitter, Facebook — or practically any app — to find people posting their Spotify Wrapped graphics. Even some of our very own Shake influencers shared their Spotify Wrapped insights.
Top shared Spotify Wrapped features
My Top Artists feature
One of Spotify users’ favorite parts of Wrapped is the “My Top Artists” category. This feature shows five of the artists you listened to most over the past year. In this Spotify Wrapped, our Shake influencer Bebsabe Duque (@bebsabeduque) shares her top five artists of 2021.

The Overall feature
This “Overall” Spotify Wrapped graphic includes top artists, top songs, total minutes listened and top genre. Whether someone’s listening to Taylor Swift or Glass Animal’s “Heat Waves,” this feature will show it all. Check out our Shake influencer Pockytheif’s (@myuumarie) top overall listening stats on Spotify.

My Audio Aura
One of the most niche and new features of Spotify Wrapped is your “Audio Aura”. In this “Audio Aura” our Shake influencer Ashley Strongarm (@ashleystrongarm) shares on her Instagram Story that her “top music moods are melancholy and yearning.” Other moods include wistful, energetic, happy, and cozy.

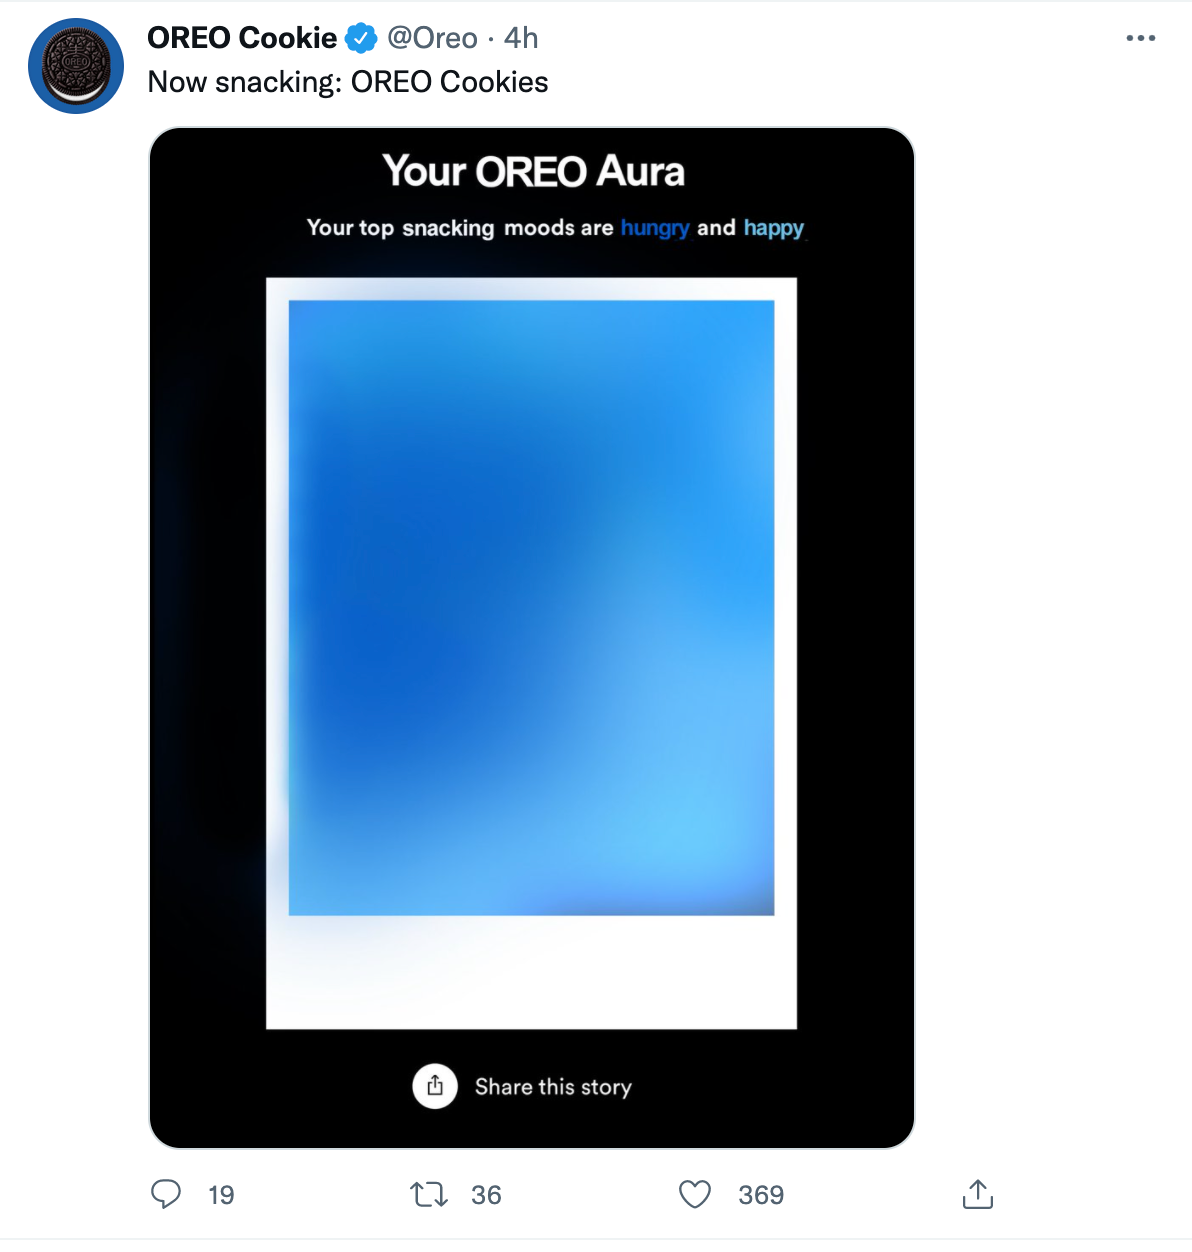
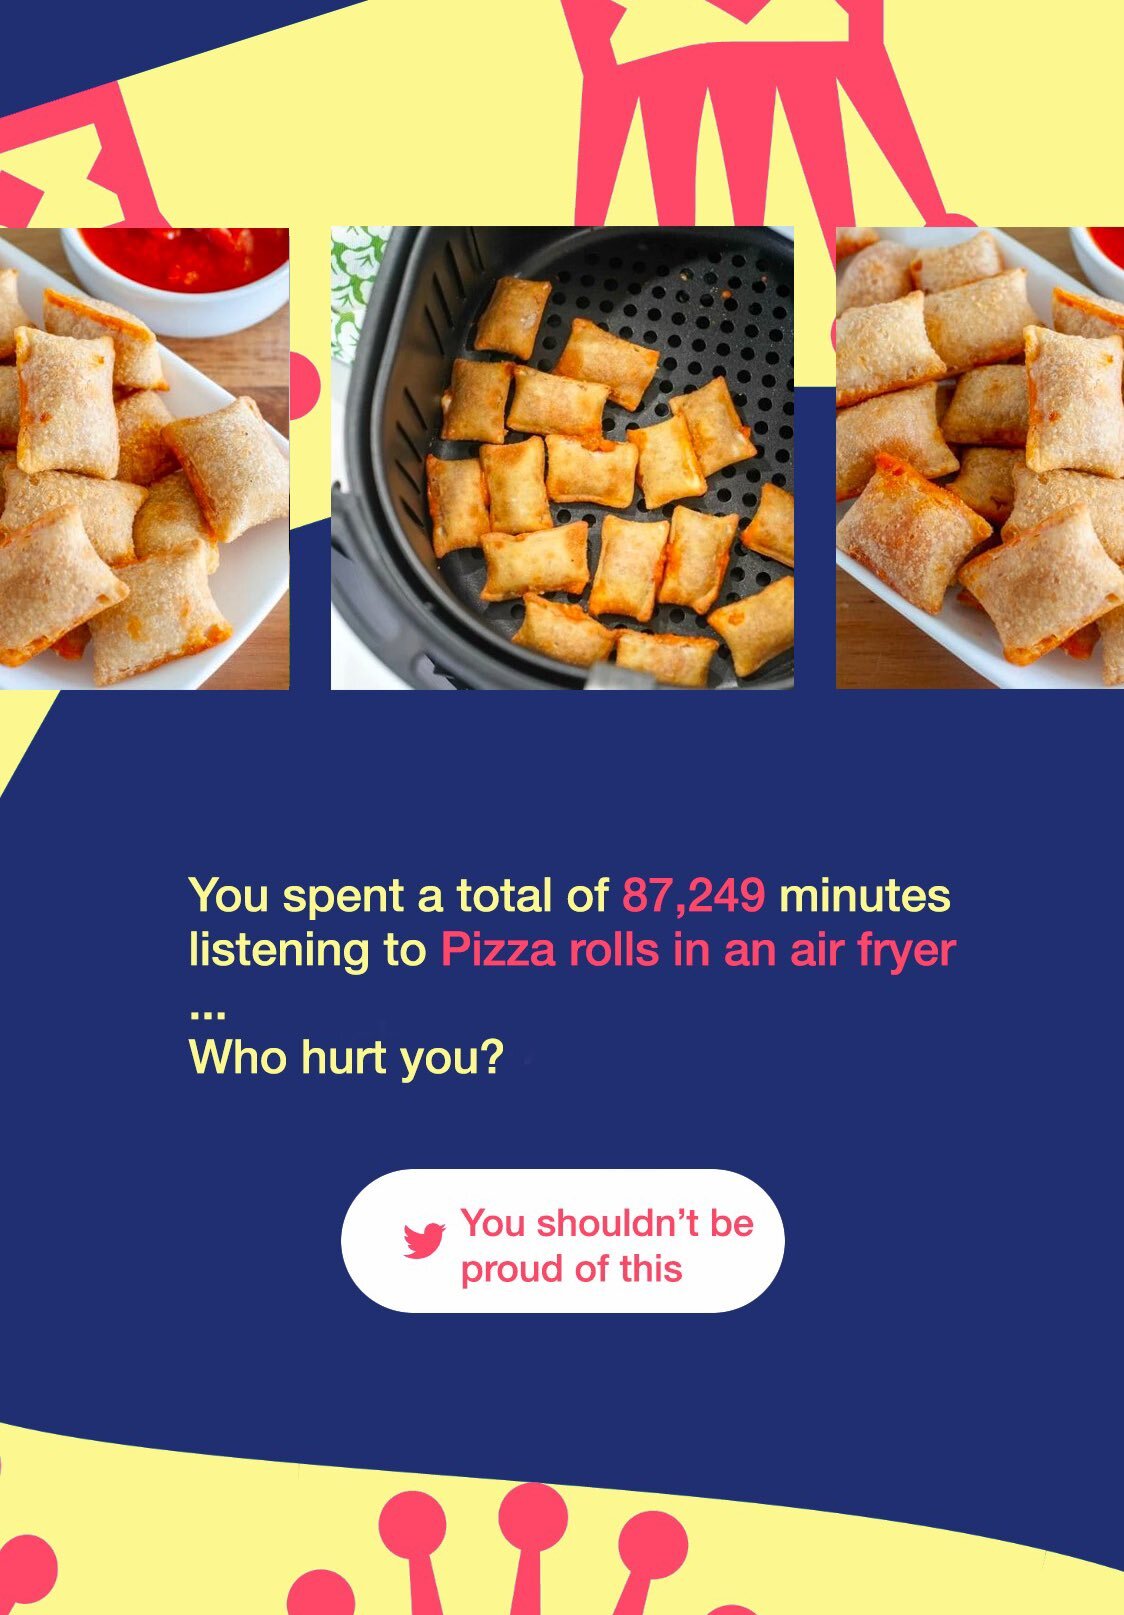
How marketers are joining the trend
While everyone’s posting about their favorite jams, companies are finding ways to join in on the hype. For instance, OREO shared its “OREO Aura” being “hungry and happy,” putting a little twist on what their Spotify Wrapped would look like. Additionally, SunnyD tapped into its Audio Aura, listing its music moods as “bold and original.” Lastly, Pete Zaroll, aka @totinos, tweeted out that it spent 87,249 minutes listening to “Pizza rolls in an air fryer.” No matter the marketer or influencer, there’s always a way to tap into these Spotify trends.
BrandGraph 500 trends happening in the Spotify world
Spotify is already one of the most popular music streaming services, but check out this BrandGraph research showing Spotify’s jump in popularity due to Spotify Wrapped coming out this month.
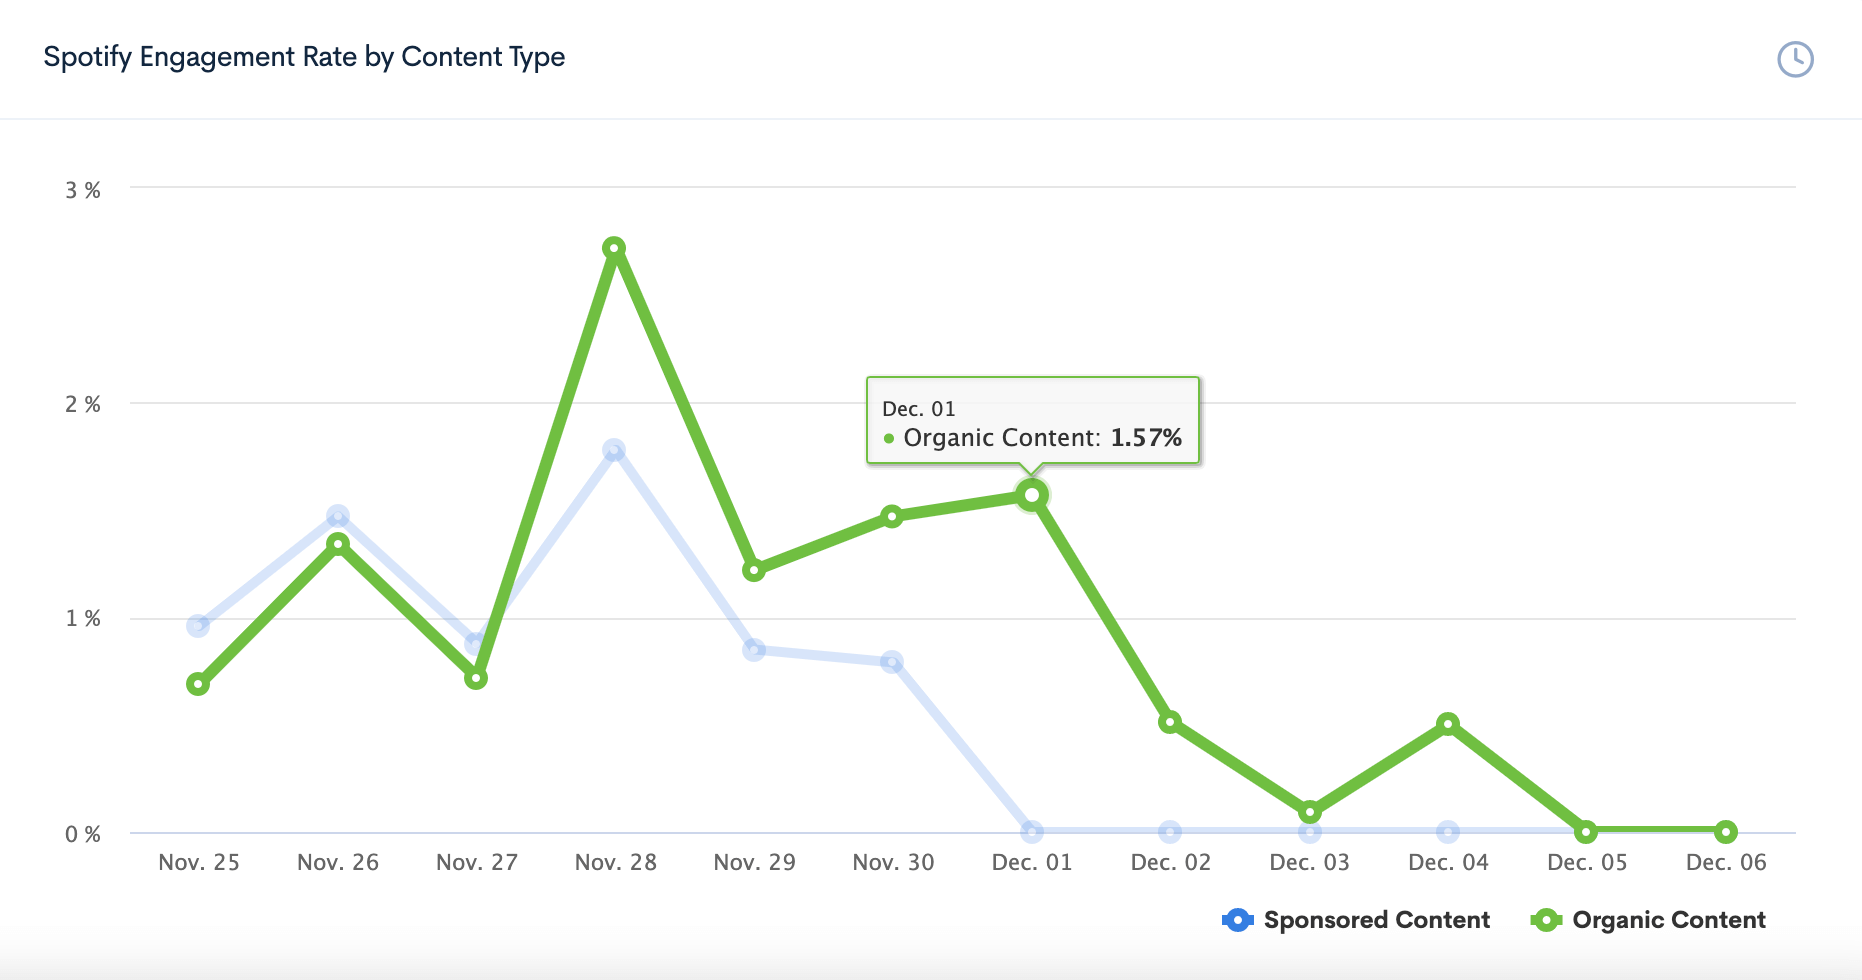
On Dec. 1, Spotify released its Spotify Wrapped feature for its users to share on any platform. BrandGraph 500 provides detailed information about Spotify’s engagement rate by content type. This research includes sponsored and organic content. As expected, Spotify’s engagement rate for organic content jumped 1.57% the day Spotify Wrapped released. With everyone sharing their Wrapped graphics on all platforms, Spotify saw a jump in organic content.
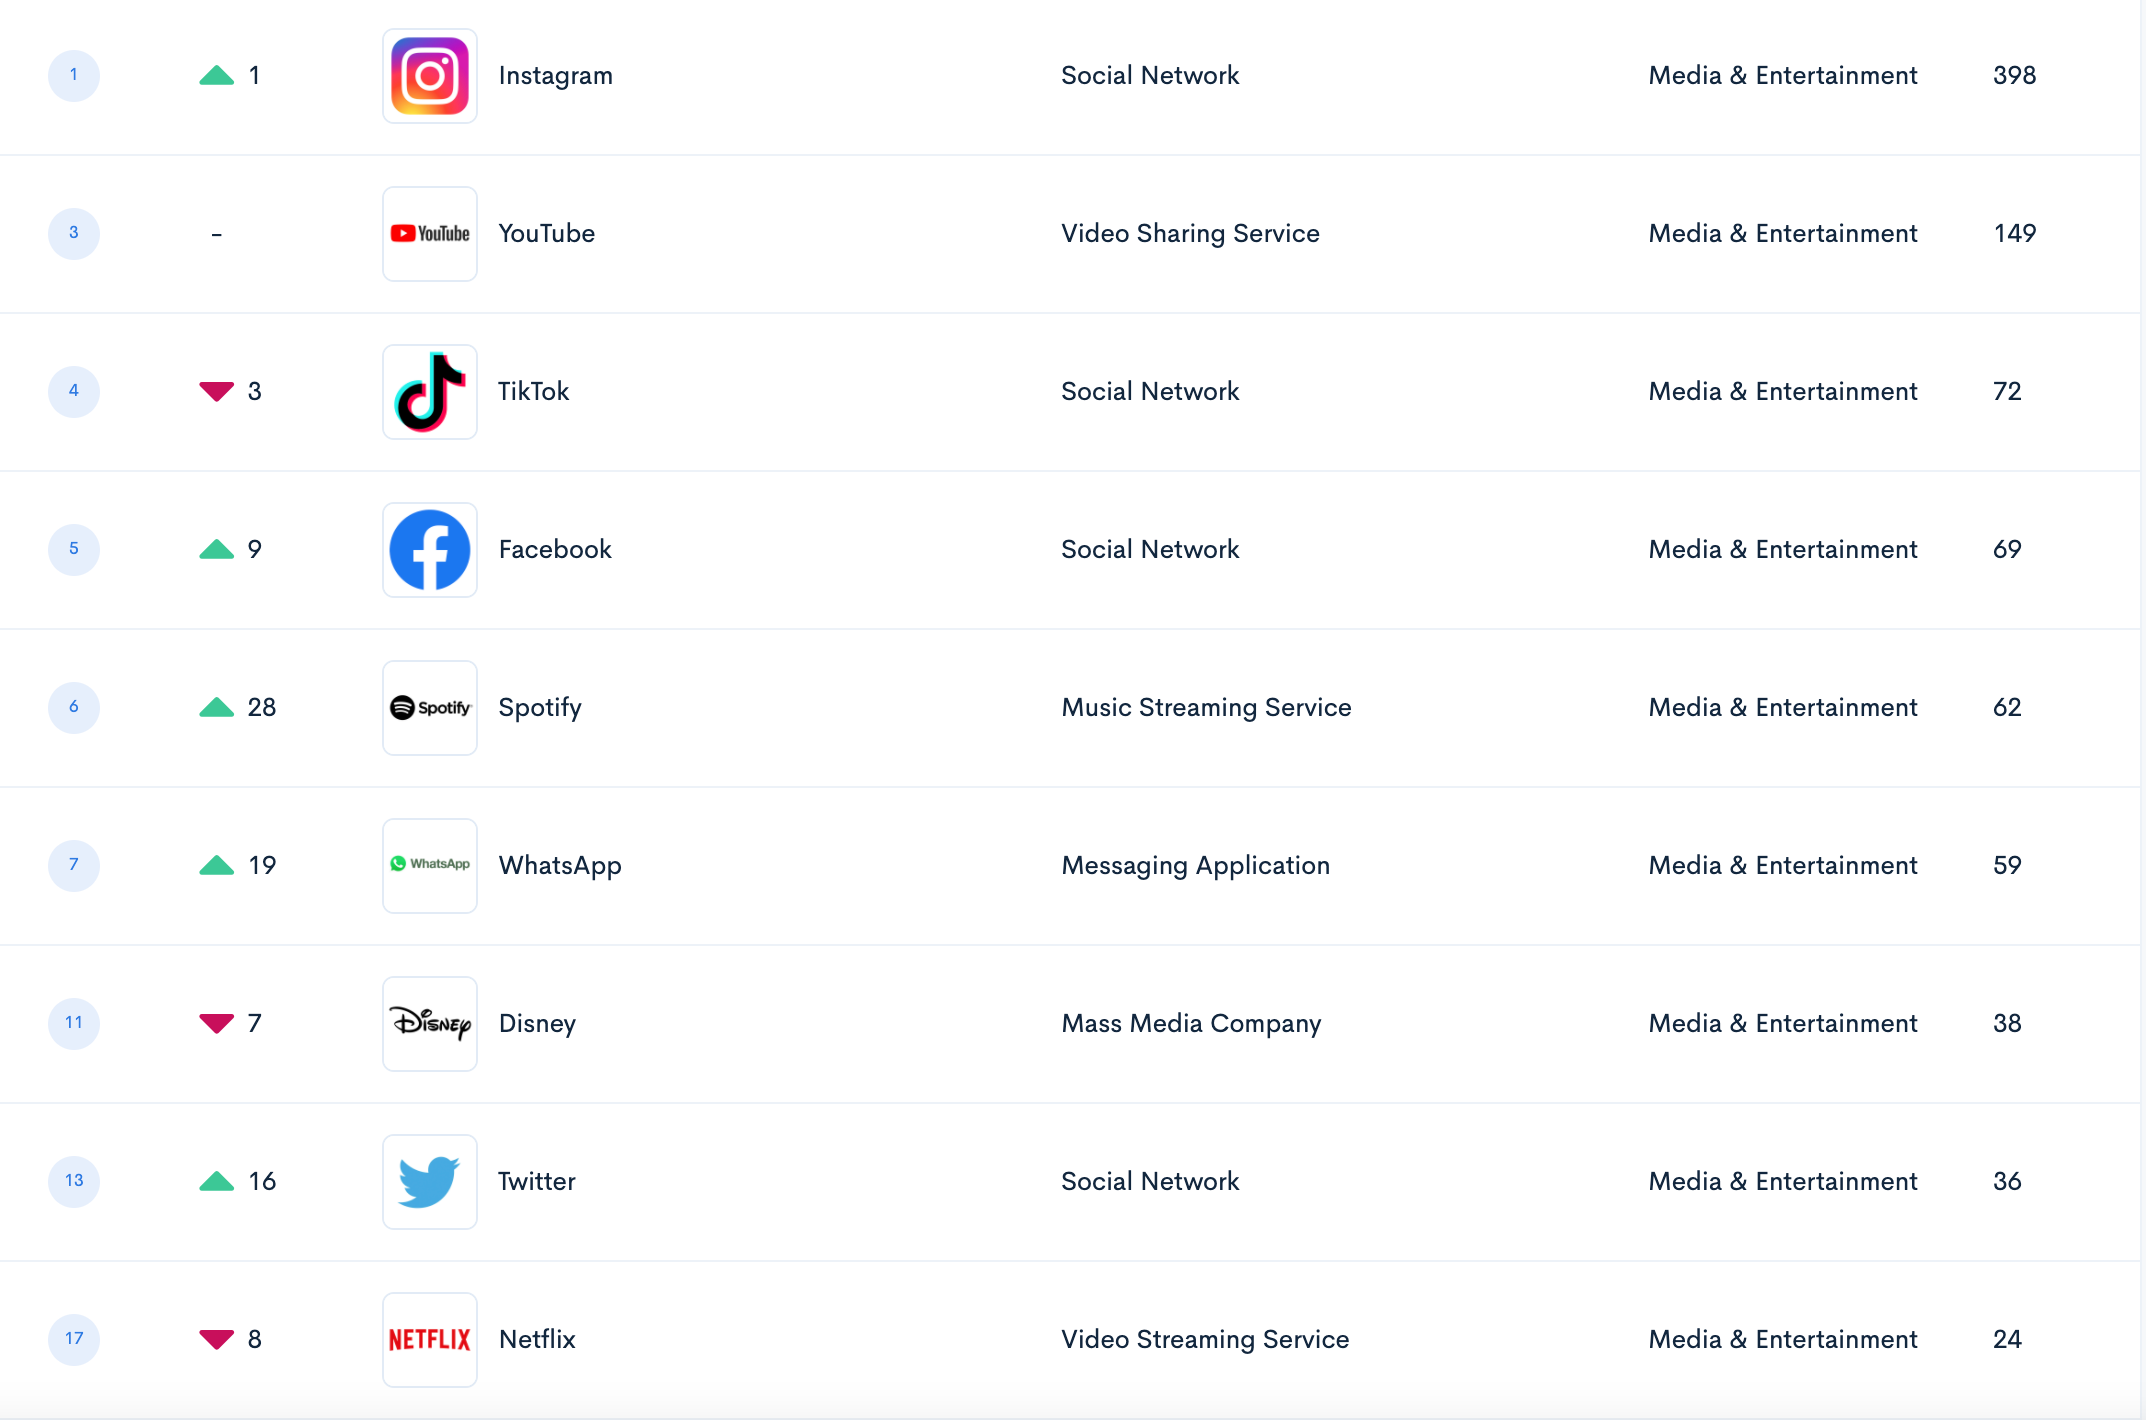
One of BrandGraph’s main functions ranks the nation’s top brands through their social content. It shows Spotify has already jumped 28 spots within the first six days of December. The jump in Spotify’s ranking is likely due to Spotify Wrapped being released early this month.

Spotify’s share of voice in the media and entertainment category reached 89.27% compared with its relatively stagnant year at 80%. Share of voice analyzes and measures the exposure a brand is getting based on conversations happening on social media and it is typically compared with competitors.
Get more insights
BrandGraph helps you measure your brand’s social media performance, benchmark against competitors, identify influencers and analyze sentiment. Get started today.